
Ho sviluppato un programma in R per elaborare i dati provenienti da diverse fonti ufficiali e calcolare indicatori statistici e grafici interattivi ed aggiornati in tempo reale con una Dashboard online sull’evoluzione del coronavirus.
READ MORE
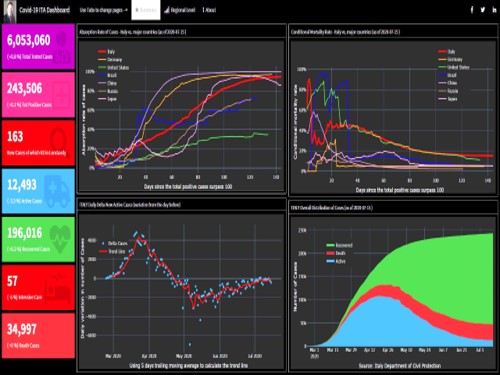

The aim of this project is to provide an insight for the business decision-makers, for that the next improvements will consider the economic impacts and the scenario analysis with a risk management point of view.. The data and charts are refreshed on a daily basis and all figures are recalculated.